See Our Work
Every sample below is fully interactive — hover, filter, and explore. Dashboards, predictive models, and forecasts built with the same tools and rigor we bring to client engagements.
Know Where You Stand
Live dashboards that show you exactly what's happening in your business right now.
 Executive View
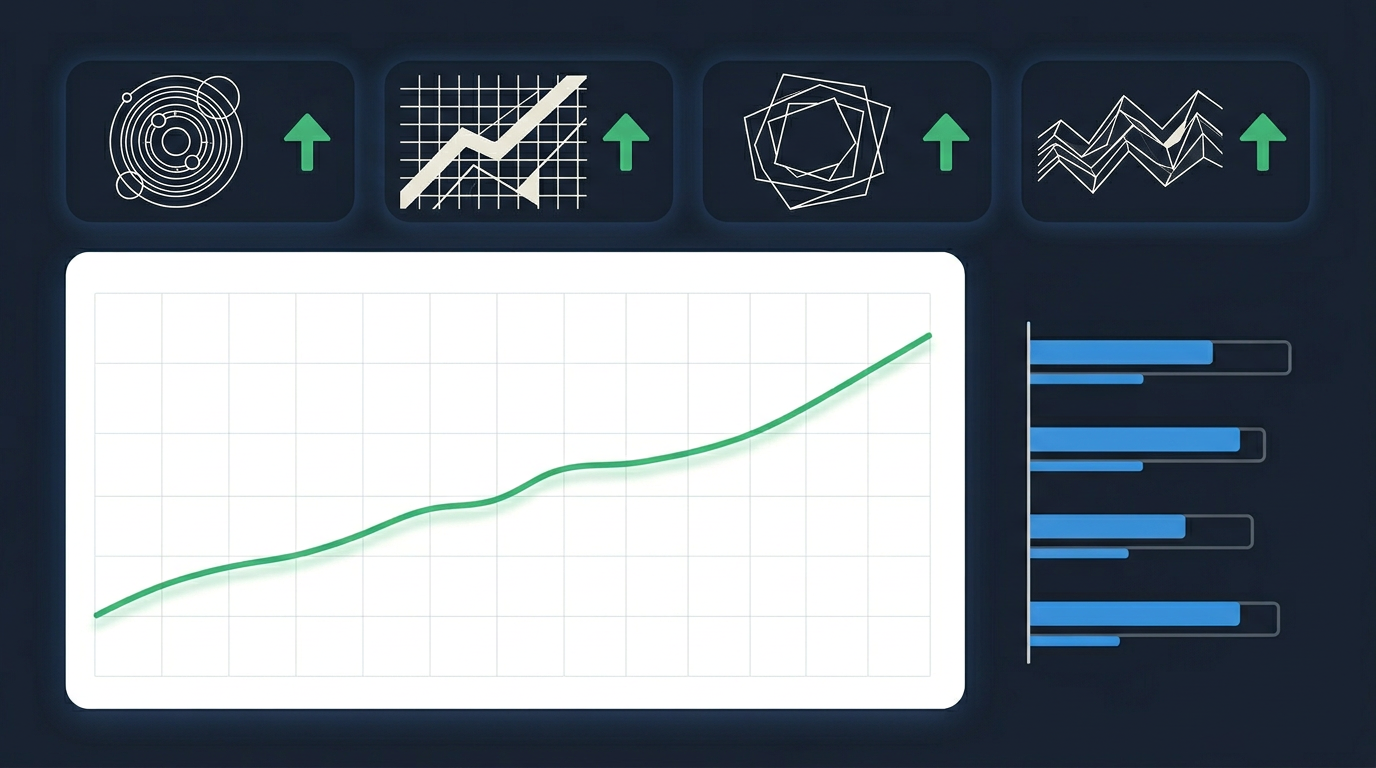
Executive KPI Dashboard
The view a CEO checks every Monday. Revenue trends, customer segmentation, and quarterly performance against targets — all in one screen.
Explore Dashboard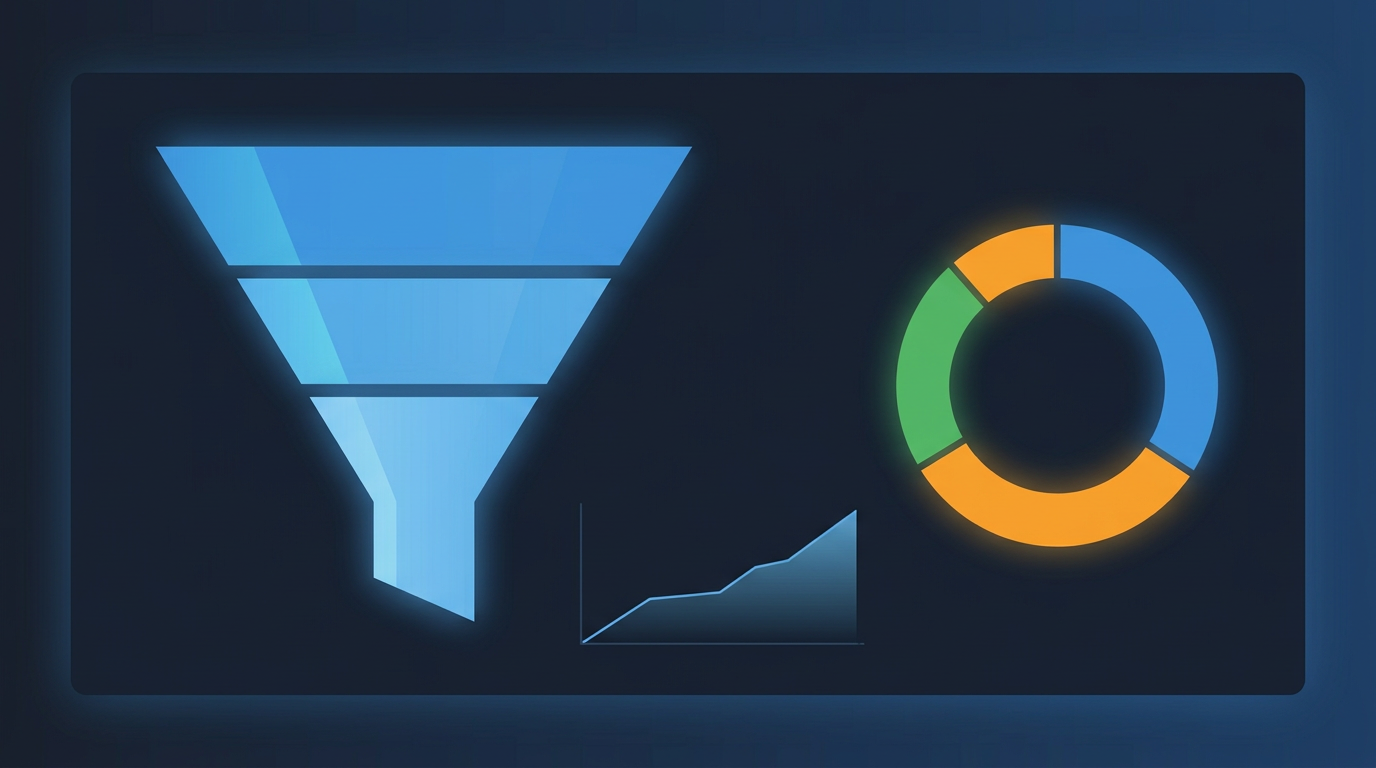 Growth View
Sales & Marketing Dashboard
Pipeline health at a glance. Track lead flow by channel, measure campaign ROI, and watch conversion rates trend over time.
Explore Dashboard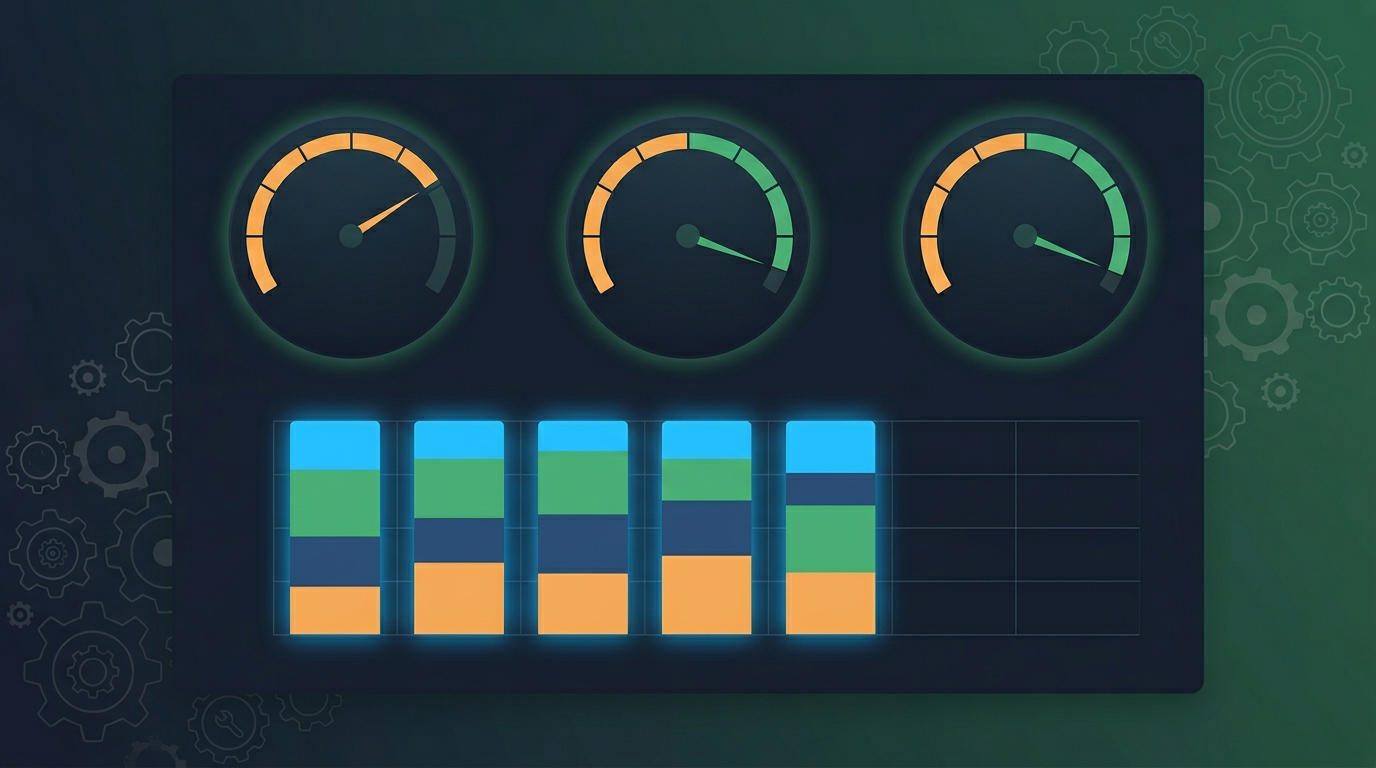 Operations View
Operations Dashboard
Fulfillment rates, staffing efficiency, and department performance. The ops manager's daily command center for spotting bottlenecks.
Explore DashboardKnow What's Coming
Predictive models that tell you what will happen next — so you can act before your competitors do.
 Predictive Model
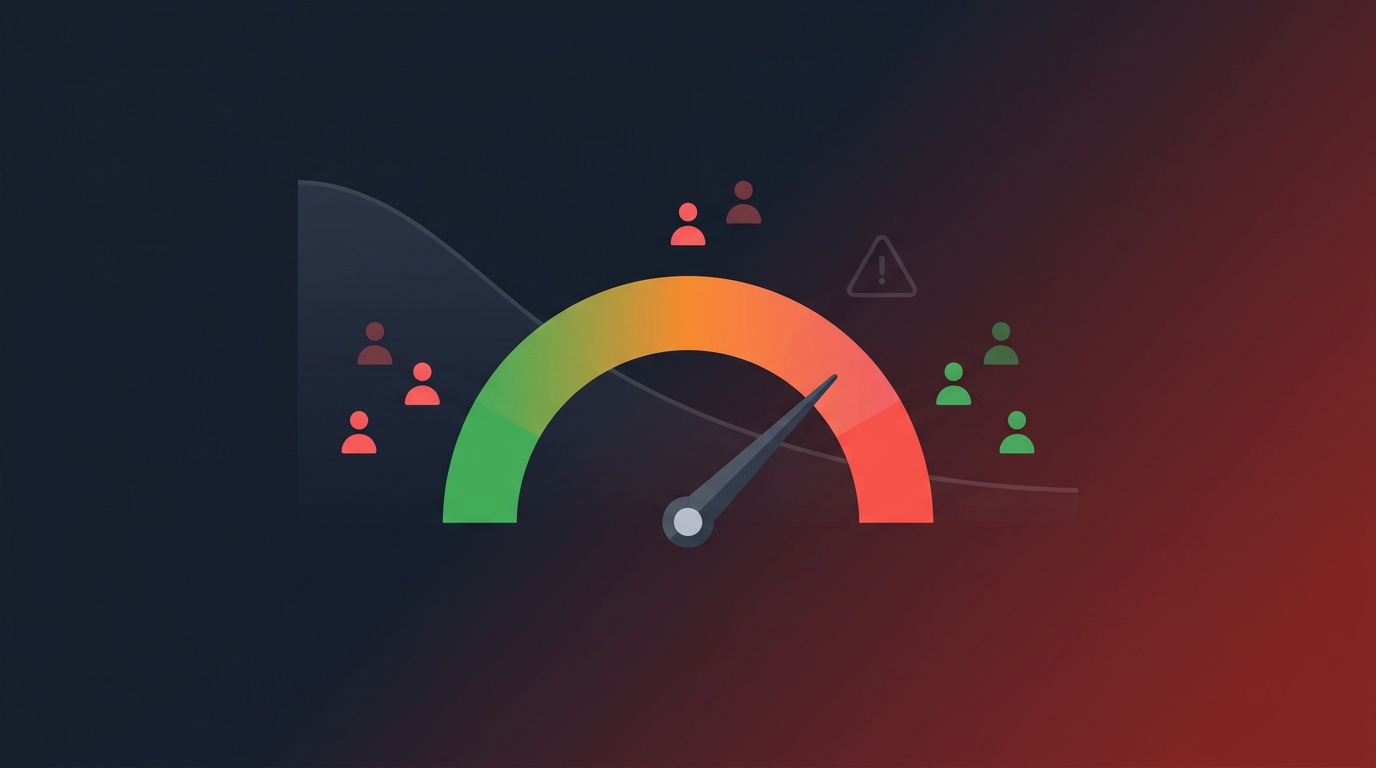
Churn Prediction Scorecard
See which customers are about to leave before they do. Risk scores, churn drivers, and the projected revenue you can save with early intervention.
Explore Scorecard Forecast Model
Demand Forecast
Historical trends meet statistical modeling. See 90-day revenue projections with confidence bands, seasonal decomposition, and product-level breakdowns.
Explore Forecast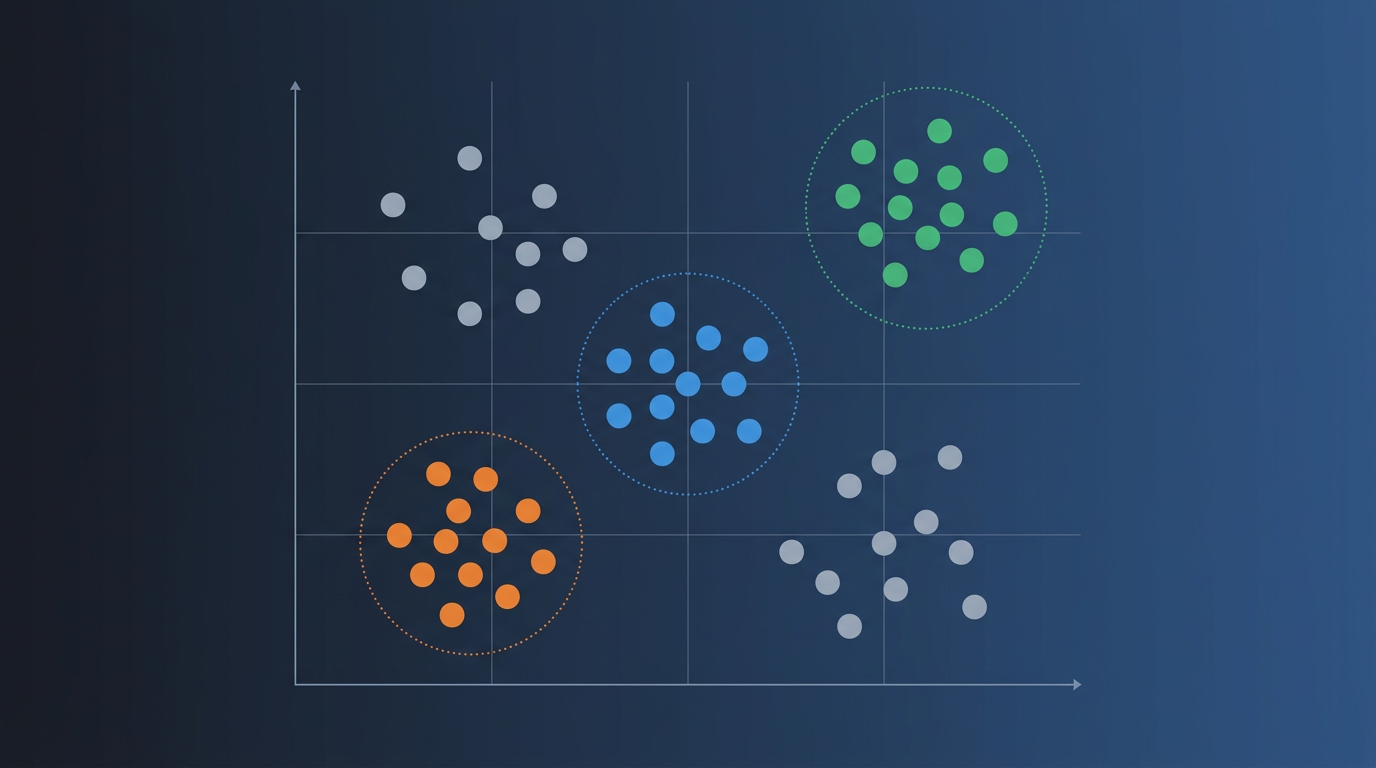 Cluster Analysis
Customer Segmentation
Find out which 20% of your customers drive 80% of your profit. We cluster your transaction data to reveal Champions, Loyalists, and At-Risk groups.
Explore SegmentsAll data shown is simulated for demonstration purposes. Client dashboards are built on your live data sources and tailored to your specific KPIs.
Want insights like these for your business?
Tell us what decisions keep you up at night. We'll build the dashboards and models that answer them.
Start a Conversation